Custom UI form
Visual Gene Developer allows a user to develop a custom UI (user interface) form (or window).
o What is 'Custom UI form (or window)'?
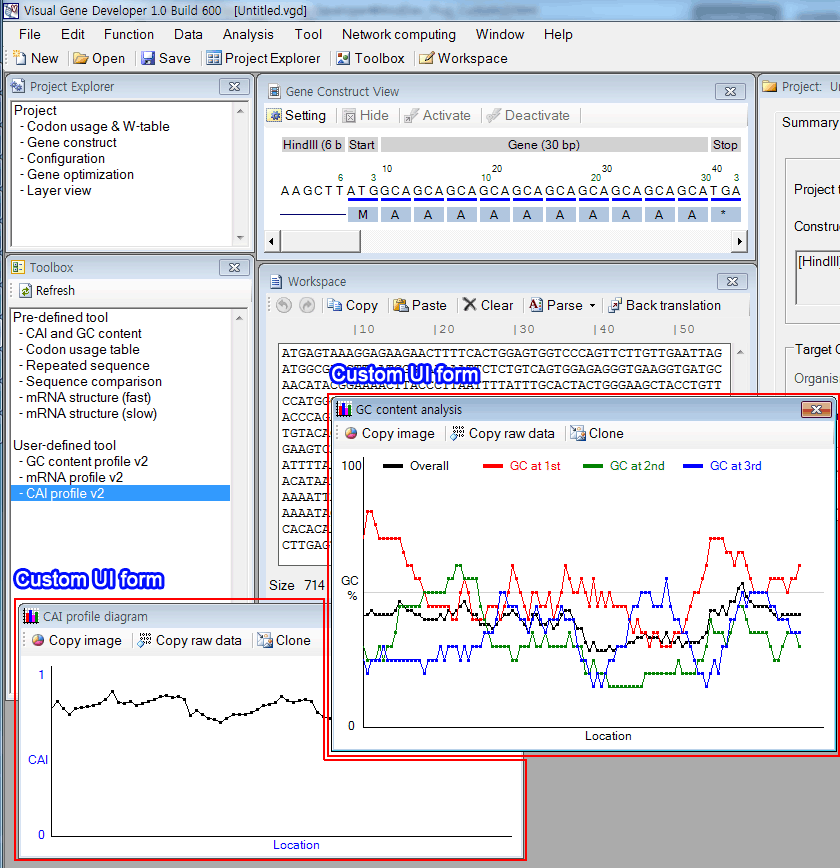
In order to analyze the CAI profile or mRNA binding energy profile of the test sequence, you may click on the menu item 'CAI profile v2' or 'mRNA profile v2' in the 'Toolbox' window. When done, the custom UI form will be pop-up as shown in the following figure. The diagram was drawn by executing a user-defined module that encodes algorithms to plot GC contents or mRNA energy profiles. Because all graphic functions are defined in the special class 'CustomUI', a user can easily make use of those functions to draw lines or text. Therefore, Visual Gene Developer gives a great advantage to expand software functionality by adding new graphical analysis windows designed by users.

Let's check the source code of 'CAI profile v2'.
It is easy to recognize that the class 'CustomUI' was used many times to draw line, string, or rectangle.
|
Function Main() '-------- Setting --------------------------------------------------------------------------------------------------------------------- Window_Size=60 'Length of partial test sequence Step_Size=3*3 'Interval between partial test sequences through the entire sequence 'It should be a multiple of 3 GeneService.Set_WTableFile=GeneService.Current_WTableFile '------------------------------------------------------------------------------------------------------------------------------------------
SourceSeq=AppService.Workspace_Value If SourceSeq="" then Exit Function End If SourceSeq_Length=Len(SourceSeq) Start_Position=1 End_Position=SourceSeq_Length
Buf_Str=""
'**** Graphics ********************** CustomUI.Define_Canvas 500,200 CustomUI.Form_BringToFront CustomUI.Clear_Canvas CustomUI.Form_Caption="CAI profile diagram" CustomUI.DrawLine 30,10,30,180,"Black" CustomUI.DrawLine 30,180,490,180,"Black" CustomUI.DrawString 5,95,"CAI","Blue" CustomUI.DrawString 250,180,"Location","Blue" CustomUI.DrawString 15,10,"1" CustomUI.DrawString 15,170,"0" CustomUI.Set_ForeColor_byName "Black"
'*** Calculate CAI ************************************************ For Current_Position=Start_Position to End_Position - Window_Size step Step_Size
AppService.InstantMsg "Calculating CAI at " + CStr(Current_Position)
TestSeq=Mid(SourceSeq,Current_Position,Window_Size) Local_CAI= GeneService.Calculate_CAI(TestSeq,True)
X2=(Current_Position-Start_Position )/SourceSeq_Length*480+30 Y2=170-(Local_CAI*160)+10 If Current_Position>Start_Position Then CustomUI.DrawLine X1,Y1,X2,Y2 CustomUI.DrawRectangle X2-1,Y2-1,2,2 CustomUI.Update_Canvas End If X1=X2 Y1=Y2
Buf_Str=Buf_Str + CStr(Current_Position) + Chr(9) + CStr(Local_CAI) + Chr(13) + Chr(10) Next
CustomUI.RawData=Buf_Str CustomUI.Make_Clone
End Function |
o Custom UI form (window)
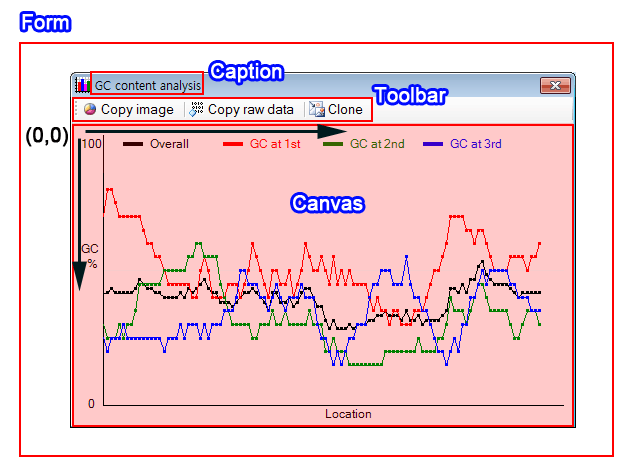
The custom UI window consists of a caption, toolbar, and canvas. A user can set 'form caption', define 'canvas' size, and plot figures in the 'canvas'.
Visual Gene Developer provides a toolbar to export the image and raw data. Clicking on the 'Clone' menu button, a user can duplicate the current Custom UI form. Regarding X Y coordinates on canvas, left top corresponds to (0,0). X values increase from the left to right and Y value increases from top to bottom.

o Specialized class 'CustomUI'
The class 'CustomUI' has the ability to generate new Custom UI forms and contains many graphic functions. The current version offers 27 functions such as Define_Canvas, Clear_Canvas, Update_Canvas, DrawLine, DrawPie, DrawRectangle, DrawBezier, and etc.
Check the complete list of functions
Visual Gene Developer provides 5 instances of the class 'CustomUI': 'CustomUI', 'CustomUI2', 'CustomUI3', 'CustomUI4', 'CustomUI5'.
Each instance represents and can operate a single independent 'active Custom UI window'. Thus, a user can handle a maximum five 'active Custom UI windows' at the same time. 'Active Custom UI window' is the window where a user draws graphics. It is different from the 'Cloned custom UI window' that can be generated by clicking on the 'Clone' button in the custom UI window.
Every module may use the same 'Active custom UI windows' and a user may need to add one line code to duplicate the 'Active custom UI window' to keep the image and raw data. The duplicated custom UI window can be called as 'cloned custom UI window'.
o How to generate custom UI form
Step 1: Define canvas and set 'Form caption'
|
CustomUI.Define_Canvas 500,200 CustomUI.Form_Caption="CAI profile diagram" |
Function: Sub Define_Canvas (Width As Integer, Height As Integer, Optional ShowToolStrip As Boolean)
Property Form_Caption () As String
Step 2 (optional): Bring the form to front and clear canvas
|
CustomUI.Form_BringToFront CustomUI.Clear_Canvas |
Function: Sub Form_BringToFront ()
Sub Clear_Canvas (Optional Color_byName As String)
Step 3: Draw graphics and update the canvas
|
CustomUI.DrawLine 30,10,30,180,"Black" CustomUI.DrawString 5,95,"CAI","Blue" CustomUI.Update_Canvas |
Function: Sub DrawLine (X1 As Integer, Y1 As Integer, X2 As Integer, Y2 As Integer, Optional ForeColor_byName As String)
Sub DrawString (X As Integer, Y As Integer, TextStr As String, Optional ForeColor_byName As String)
Sub Update_Canvas ()
When you call 'Update_Canvas' function, Visual Gene Developer refreshes canvas to show an updated image. However, it doesn't need to update the canvas every time. When you draw graphics like line, pie, or rectangle, the canvas is already internally updated even if it doesn't show the updated image in real-time. Please remember that frequent calling of 'Update_Canvas' function may delay processing time. However, a user may prefer it to give an animation effect.
Step 4 (optional): Store raw data for data export
|
CustomUI.RawData="Location" + Chr(9) + "CAI value" + Chr(13) + Chr(10) + "1" + Chr(9) + "0.8" |
Function: Property RawData () As String
Grammar: Chr(9) generates Tab key,
Chr(13) + Chr(10) generates Carriage return
A user store raw data (not image) to the custom UI window. When you call this function, the 'Copy raw data' toolbar button in the custom UI window will be activated. Now, a user can export text raw data to the clipboard anytime once he stores it.
Step 5 (recommended): Generate 'custom UI clone' and close 'active custom UI window'
|
CustomUI.Make_Clone |
Function: Sub Make_Clone ()
When a user calls this function, Visual Gene Developer duplicates the current 'active custom UI form (window)' and then close 'active UI form'. Apparently, a user may not distinguish between 'active custom UI form' and 'cloned custom UI window' because the duplicated custom UI window will be shown exactly at the same location with the same size. This function is important to keep the user's data in a separate UI form. We remind you that there are five instances of the class 'CustomUI' and consequently five active Custom UI windows. Active custom UI windows can be shared with other modules.
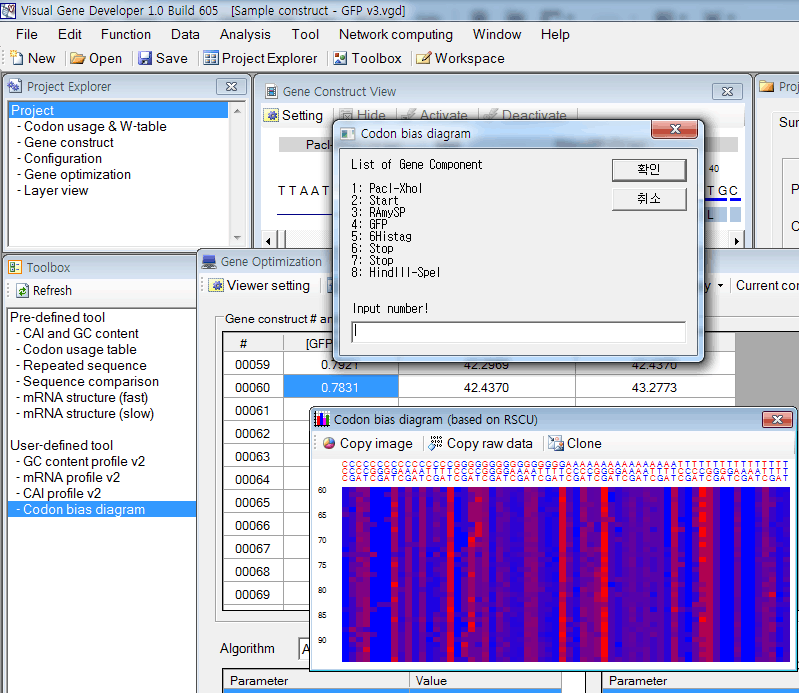
o Advanced example 1: Codon bias diagram
* Imitation of the job done by Plotkin and Kudla (Nature, 2011, p32-42)
* The algorithm was developed using VBScript. Check the code in the 'Module Library' and 'Module Editor' windows

VBScript
Sub Main()
'***** Setting *******************
MaxConstruct=99
LineWidth =7
LineHeight =5
'**** Ask target Gene Component ************
Info_Str=Get_ListOfComponents
Info_Str="List of Gene Component" + VBCrLF + VbCrLF + Info_Str + VbCrLF + + VbCrLF + "Input number!"
ComponentIndex=InputBox(Info_Str,"Codon bias diagram")
ComponentCount= GeneConstruct.ComponentCount
If ComponentIndex <= 0 or -ComponentCount > -ComponentIndex Then
MsgBox "Incorrect number!"
Exit Sub
End If
'**** Set Range **********************************************************
Currnent_ConstructIndex=GeneConstruct.CurrentConstructIndex
Construct_Count=GeneConstruct.ConstructCount
Construct_End=Currnent_ConstructIndex + MaxConstruct
If Construct_End>Construct_Count Then Construct_End=Construct_Count
'**** Initialize Graphics **********************
CustomUI.Define_Canvas 64*LineWidth+35,(Construct_End-Currnent_ConstructIndex)*LineHeight +40
CustomUI.Form_BringToFront
CustomUI.Clear_Canvas
CustomUI.Form_Caption="Codon bias diagram (based on RSCU)"
'**** Draw Codon text **********************
Output_Str="Number" + VBTab
CustomUI.Set_Font 8
For Triplet_1st=1 to 4
For Triplet_2nd=1 to 4
For Triplet_3rd=1 to 4
CurrentTriplet=IndexToCGAT(Triplet_1st)+IndexToCGAT(Triplet_2nd)
CurrentTriplet=CurrentTriplet+IndexToCGAT(Triplet_3rd)
CurrentY=4
CurrentX=((Triplet_1st-1)*16+(Triplet_2nd-1)*4+(Triplet_3rd-1))*LineWidth +30
If Triplet_3rd=1 or Triplet_3rd=3 Then
CustomUI.Set_ForeColor_byName "Red"
Else
CustomUI.Set_ForeColor_byName "Blue"
End If
CustomUI.DrawString CurrentX-1,CurrentY-3, IndexToCGAT(Triplet_1st)
CustomUI.DrawString CurrentX-1,CurrentY+4, IndexToCGAT(Triplet_2nd)
CustomUI.DrawString CurrentX-1,CurrentY+11, IndexToCGAT(Triplet_3rd)
Output_Str=Output_Str + CurrentTriplet + VbTab
Next
Next
Next
Output_Str=Output_Str + VBCrLF
'**** Draw codon rscu diagram *************************************
CustomUI.Set_Font 8
For q = Currnent_ConstructIndex to Construct_End
SourceSeq=GeneConstruct.ParameterValue(q,ComponentIndex,"Modified DNA")
GeneService.Calculate_CodonUsage SourceSeq
CurrentY=(q-Currnent_ConstructIndex+1)*LineHeight +23
If q=Int(q/5)*5 Then
CustomUI.DrawString 5,CurrentY-1, CStr(q),"Black"
End If
Output_Str=Output_Str + CStr(q) + VBTab
For Triplet_1st=1 to 4
For Triplet_2nd=1 to 4
For Triplet_3rd=1 to 4
CurrentTriplet=IndexToCGAT(Triplet_1st)+IndexToCGAT(Triplet_2nd)
CurrentTriplet=CurrentTriplet+IndexToCGAT(Triplet_3rd)
CodonAddress64 =GeneService.Get_CodonAddress_Type64(CurrentTriplet)
CodonRSCU=GeneService.Get_CodonUsage_RSCU(CodonAddress64 )
CurrentX=((Triplet_1st-1)*16+(Triplet_2nd-1)*4+(Triplet_3rd-1))*LineWidth +30
CustomUI.Set_FillColor_byRGB CodonRSCU/3*255,0,255-CodonRSCU/3*255
CustomUI.FillRectangle CurrentX,CurrentY,LineWidth,LineHeight
Output_Str=Output_Str + CStr(CodonRSCU) + VbTab
Next
Next
Next
CustomUI.Update_Canvas
Output_Str=Output_Str + VBCrLF
Next
CustomUI.RawData=Output_Str
CustomUI.Make_Clone
End Sub
Function IndexToCGAT(IndexNumber)
Select case IndexNumber
Case 1
IndexToCGAT="C"
Case 2
IndexToCGAT="G"
Case 3
IndexToCGAT="A"
Case 4
IndexToCGAT="T"
Case Else
IndexToCGAT=""
End Select
End Function
Function Get_ListOfComponents
Buf_Str=""
ComponentCount=GeneConstruct.ComponentCount
For q=1 to ComponentCount
Buf_Str=Buf_Str + CStr(q) + ": " + GeneConstruct.ComponentName(1,q) + VBCrLf
Next
Get_ListOfComponents=Buf_Str
End Function
